Delay your decisions
Een artikel, meer 6 jaar geleden geplaatst onder agile, design, project, keycloak, json, editor, visualisation, visual & graphing.

Delay your decisions

I design very little upfront. Sometimes I need to make an estimation, I design a little more. Sometimes the project is hardly specced and there is a lot of exploring to do.

In this post I would like to give a demonstration of how a recent project developed.

Initial stage

> Client: “We want a fancier frontend for our data”.
> Me: “Sure, any limitations?”
> Client: “We give you 4 months”
> Me: “Can I use any tech I want?”
> Client: “Na, we want to be able to continue on what you’re going to create, so please use P, X, Y and/or Z.”
> Me: “Sure, P is not my favourite, but some time ago I’ve dealt with it, so ok, we keep it simple anyway.”

The plan that followed:

Initially I thought I could fancy up the CSS, but the old product was in a very bad state and not really maintainable. So I decided to create a thin API layer in P (yes of PHP), a modern front-end layer in JavaScript using a framework that I co-introduced in the organisation a few years ago (R…
Op de hoogte blijven?

Maandelijks maak ik een selectie artikelen en zorg ik voor wat extra context bij de meer technische stukken. Schrijf je hieronder in:

Mailfrequentie = 1x per maand. Je privacy wordt serieus genomen: de mailinglijst bestaat alleen op onze servers.

Tag descriptor

Charting on the web

Een artikel, meer 7 jaar geleden geplaatst onder charts, d3js & visualisation.

I've been collecting cool visualisation libraries over the years. Much of those which I thought looked interesting 6-8 years ago are long gone already. One of the few that did survive was a commercial one, Highcharts, which is still worth checking out, even today. As for the open source ones, I have considered often alternatives to Chart.js, but as this project is still seeing active development after > 10 years I think Chart.js the safest bet you can make when considering 2D graphing libraries.

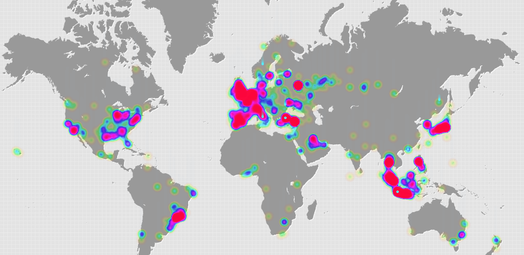
A world of tweets

Een afbeelding, ongeveer 13 jaren geleden geplaatst onder design, twitter, network, social, world, visualisation & tweet.

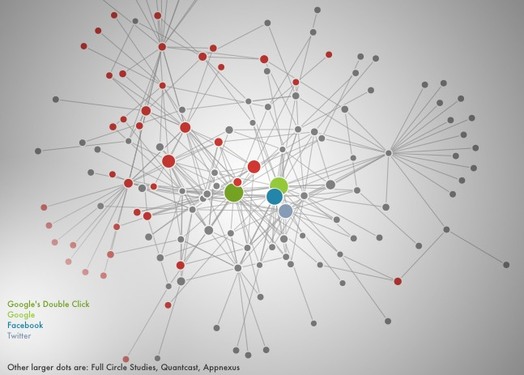
A day of serving (by surfing), visualized by Collusion

Een afbeelding, bijna 14 jaren geleden geplaatst onder web, twitter, google, network, facebook, privacy, visualisation, surfing, serving & post.